


What is earnings per share?
Earnings per share, or EPS, is one of several metrics that ASX investors use to help them value a company and decide whether or not to invest in it.
EPS refers to a formula whereby a company’s profit or net income is divided by the number of outstanding shares. This gives investors an indication of how much profit per share is being returned to shareholders.
It’s an important concept to understand because it is also used in several other ways to evaluate an ASX company’s appeal for investment. A related metric is the price-to-earnings (PE) ratio, which we’ll discuss later.
How to calculate EPS
The EPS formula is as follows:
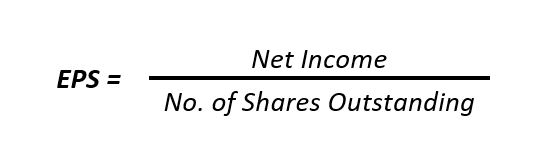
Note that the EPS calculation does not usually use the EBITDA metric, which stands for earnings before interest, taxes, depreciation, and amortisation.
We mention this because EBITDA is a common substitute for earnings in other contexts. However, calculating a company’s EPS typically uses net income, including the costs listed above that the EBITDA metric discards.
You’ll come across companies that do not have an EPS value in your research. They are yet to turn a profit, so their EPS is effectively zero (or even a negative number). This doesn’t mean the company is broke or bankrupt! It usually means they’re in the growth stage and focused on maximising revenue over profit.
Basic EPS vs. diluted EPS
When analysing a company, investors like to look at two types of EPS numbers: basic EPS and diluted EPS.
They are similar in that they both use the above formula for calculation. However, there is one significant difference.
Basic EPS considers all shares currently outstanding, as per the formula above. Diluted EPS does the same but adds any shares the company might have quarantined for items such as share options, warrants, or shares allocated to management or employees as part of their remuneration.
The diluted earnings metric assumes that all of these shares are issued, as per the formula below:
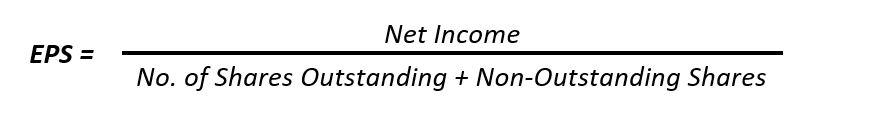
As such, the diluted EPS number will typically be lower than the basic EPS number due to including these ‘unissued’ shares in the overall share count. Many investors prefer to use the diluted EPS metric, where applicable, as it is more conservative and takes into account more potential outcomes.
Why is measuring EPS important?
When analysing an ASX company for potential investment, most investors take a long, slow look at the annual EPS recorded and how it has changed over time.
As EPS effectively measures how much profit is returned to a company’s owners, it indicates its past performance.
If a company has been growing its EPS at a healthy rate in recent years, it’s usually a good indication that it will continue to do so. A higher EPS can indicate the company has the potential to be a successful investment.
Conversely, if a company’s EPS has been going backwards in recent years, that’s usually a red flag. Sometimes, a company can justify a falling EPS by extraordinary circumstances, so you must do further research to discover why.
Other uses of earnings per share
Investors also use EPS to calculate other standard metrics for investing in ASX shares, such as the PE ratio we touched on earlier.
The PE ratio measures a company’s share price relative to its earnings per share. This is an excellent metric for comparing different companies in the same industry or sector.
For example, if a mining company’s PE ratio is 15 and the mining industry’s PE ratio is 20, it might indicate the company is a good buy at its current share price.
Dividend investors, in particular, will be familiar with the payout ratio. This ratio measures how much a company’s earnings are paid out in dividends each year. For example, if a company’s EPS is $2 and it pays out $1 per share in dividends, it will have a payout ratio of 50%.